

How Much An Average House Cost In The 1960s Vs. Today
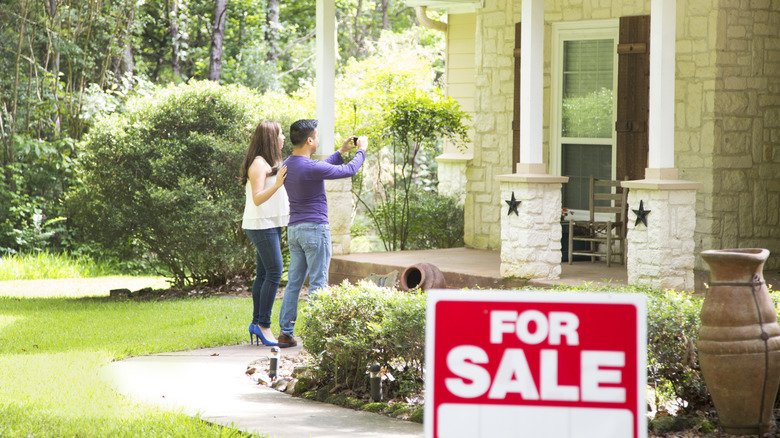
Although you may hear on the news that single-family homes are dropping in price, it may not feel that way when you're looking through real estate listings. High prices in the current market can cause some people to feel like times have changed to the point where discouragement replaces the excitement of home shopping. You may wonder how people in past generations could have possibly afforded a home.
Homes have certainly risen in price in recent years, but the broader increase has unfolded over multiple decades. At the beginning of the 1960s, for example, your parents or grandparents saw a typical home price of $11,900 (in 1960 dollars), according to the U.S. Census Bureau. By the end of the 1960s, the average price for a house had reached $27,900 (in 1969 dollars). Meanwhile, in July 2026, the average price of a house in the United States reached $508,800, according to the U.S. Census Bureau and the Department of Housing and Urban Development. Those numbers may be hard to believe, but they show today's home average U.S. price is 42.75 times more than in 1960 and 18.24 times more than in 1969. (The average price of a home is determined by adding the price of all homes sold during a period and dividing that sum by the number of homes sold in the same period.)
How inflation has affected home prices since the 1960s
If finding a starter home today feels like a lost cause as a new homebuyer, you might blame inflation for the significant price increase since the 1960s. However, inflation is only part of the explanation. A 2024 report from Clever Real Estate found that home prices had risen 2.4 times faster than overall inflation since the 1960s. Put another way, house prices in 2024 were 24 times higher than they were in 1963, according to Clever's data, while overall prices had increased roughly tenfold over the same period.
The previously mentioned home-price data also illustrate the broader point made in the Clever study. According to the CPI Inflation Calculator from the U.S. Bureau of Labor Statistics, $1 in January 1960 had the same buying power as about $11.40 in July 2026. Based solely on inflation, a home that cost $11,900 in early 1960 would cost approximately $135,660 in July 2026 dollars. The home that cost $27,000 in late 1969 would have an approximate cost of $239,145 today based on inflation alone. Such numbers are far below the average cost of a home in 2026, showing that factors beyond general inflation have contributed to the long-term rise in housing prices.
Other reasons housing prices are much higher than the 1960s
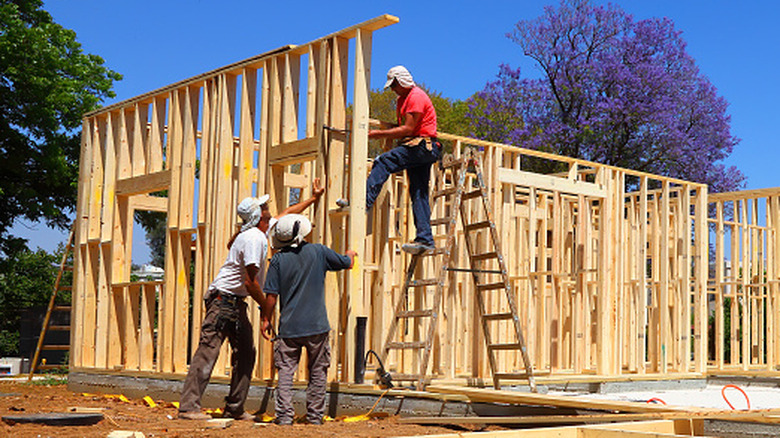
Several factors help explain why housing prices in the United States have risen faster than overall inflation since the 1960s. One issue is that building new homes takes time, roughly 10.5 months from the start of the permitting process to completing the finishing touches. Other types of consumer products can benefit from a far faster scale-up in production, allowing supply to adjust to rising demand faster than housing can.
Newly built houses are also larger than they were in the 1960s, which can contribute to higher prices. According to the U.S. Census Bureau, the median single-family home built in the 1960s was about 1,500 square feet. In 2025, the U.S. Census Bureau reported that the median newly completed single-family home was 2,142 square feet. This represents a 42.8% increase in square footage, helping explain some of the cost increase for homes.
A strong economy can also affect the housing market's prices. When the economy is strong, improving employment and household finances can increase demand for homes. When the inventory of homes for sale is below market demand, prices naturally increase. Changes in economic conditions, buyer demand, and the mix of homes being sold can all contribute to month-to-month swings in average home sales prices. For example, the U.S. Census Bureau and the Department of Housing and Urban Development reported that the average sale price for new homes rose from $498,900 in April 2026 to $527,600 in May, a difference of about 5.8%. Shopping for a home during a month with a sharp spike in prices can make the pricing problem feel worse than it might be a few months later.